 Lab
7. EPR Spectroscopy. Introduction.
 Lab
7. EPR Spectroscopy. Introduction.
Objective: You will learn what kind of information ESR can provide both, spectroscopic and kinetic, and investigate some organic and inorganic radicals and ion radicals and gather information anot only bout their hyperfine structure but also what may affect it (e.g. concentration, oxygen etc.)
Electron Paramagnetic Resonance (EPR), often called Electron Spin Resonance (ESR), is a branch of spectroscopy in which electromagnetic radiation (usually of microwave frequency) is absorbed by molecules, ions, or atoms possessing electrons with unpaired spins, i.e. electronic spin S > 0. EPR is similar to Nuclear Magnetic Resonance (NMR) which you will get acquainted with in the Lab 8. The NMR technique deals with nonzero nuclear spins, I > 0.
In both EPR and NMR, the sample material is immersed in a strong static magnetic field and exposed to an orthogonal low- amplitude high-frequency field. ESR usually requires microwave-frequency radiation (GHz), while NMR is observed at lower radio frequencies (MHz). With ESR, energy is absorbed by the sample when the frequency of the radiation is appropriate to the energy difference between two states of the electrons in the sample, but only if the transition satisfies the appropriate selection rules.
Most of materials in a bulk form at normal conditions have net zero electronic spin and, thus, are EPR silent, but some are can provide an EPR signal. In this lab will analyse some representative species from the three groups below:
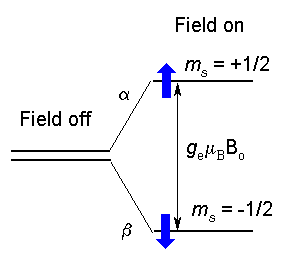 In EPR, because of the interaction of
the unpaired electron spin moment (given by two projections, ms
= ± 1/2, for a free electron) with the magnetic field, the
so-called Zeeman effect, different projections of the spin gain
different energies, as shown below and on the figure to the
right:
| Ems = gmBBoms | (1) |
Here Bo is the field strength of the external magnetic field. The SI units for magnetic field is tesla,T, but, historically in EPR, gauss (1 G = 0.0001 T) is still used. Other terms in Eq.(1): ms - is a spin projection on the field (ms = ± 1/2 for a free electron), mB is the Bohr magneton:
| mB = |eh/ 4pme|= 9.2740 x 10⁻²⁴ J/T | (2) |
with e and me beeing electron charge and mass, respectively, and h-Planck's constant. Parameter g for free electron, ge, has the value close to two: ge = 2.0023193. If the electron has nonzero orbiatl angular moment, L, the g-value (sometimes called factor Landé) becomes:
g = 1 + |
S(S + 1) - L(L + 1) + J(J + 1) | (3) |
2J(J + 1) |
The overall magnetic momentun, meff , can be expessed via overall angular momentum, J, and the g-value:
| meff = gmB[J(J + 1)]1/2 | (4) |
For most of organic radicals and radical ions, unpaired electrons have L close to zero and the total electron angular momentum quantum number J is pretty much the spin quantum number, S. As result, their g-values are close to 2. Situation becomes much more complicated with transition metals. Not only they have large L's and S's, but these values depend on the surrounding electric fields of ligands, making everythings messier but also more interesting. In this case, Eq.(1) should be written as EmJ = gJmBBomJ, stating that the Zeeman splitting appears in accordance with the total angular momentum projection, mJ. If L = 0 then J = S, and Eq.(1) will define the energies of all the possible projection of ms from -S to S - 1, S (2S + 1 of such).
If the molecule contains nuclei with magnetic moments, such as protons, their interaction with external field and the electronic magnetic moment will change stationary energies of Eq.(1). The nuclear angular momentum quantum number I determines the nuclear magnetic moment the same way as for the electron:
| m = gNmN[I(I + 1)]1/2 | (5) |
with mN now being the nuclear Bohr magneton:
| mN = eh/ 4pmp = 5.051 x 10⁻²⁷ J/T | (6) |
much smaller value because of the ~2000 times more heavier proton mp. The nuclear g factor, gN, is obtained from a knowledge of the structure of the nucleus. Some of them are given here. Interaction with external field splits the nuclear sublevels due to Zeeman interaction the same way as for electron spin:
| EmI = gNmNBomI | (7) |
where mI is one of the 2I + 1 projections of the nuclear spin. Electron-nuclear interaction will depend on the projections of both, electron and nuclear spins:
| Eelectron-nuclear = A mI ms | (8) |
where coefficient A, a so-called hyperfine coupling constant/interaction (hfi), depends not only on the g-values for the electron and the nucleus but also on the distance between them and their orientation with respect to the external field (dipole-dipole interaction). In solutions, the anisotropic part of this interaction averages out because of the fast molecular rotation. The remaining isotropic part is given by the Fermi contact interaction in the form:
| A = (8p/3)gNmNgemBr(0) | (9) |
where r(0) = |y(0)|2 is the unpaired
electron density at the nucleus. For pure 1s electron on hydrogen
atom, A equals h x 1420 MHz. Some other hyperfine
constants can be found here. As a matter of convinience, hyperfine
constants are usually given in Gauss, a = A/gemB. For example, hydrogen it
corresponds to a = 508 G. Summing up all energies, we
arrive at modified Eq. (1):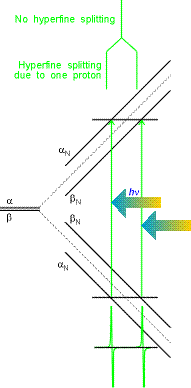
| E = gemBms(Bo + S aimIi) - gNmNBomI | (10) |
You should note two important things:
Hydrogen atom example is given on the right. In EPR, allowed transitions correspond to the change of only ms:
| Dms = ± 1, DmI = 0 | (11) |
i.e. electronic spin "flips" but the
nuclear one remains unchanged. Thus, in the figure on the right
for hydrogen atom, only two transitions can be observed for a
single resonant frequency hn. (This is a typical mode of EPR signal detection:
microwave frequency is kept constant and magnetic field is varied).
These transitions are separated by the hyperfine constant a
(508 G for hydrogen atom). If there are more than one hydrogens,
each of them will contribute to the change in magnetic field on
the electron. 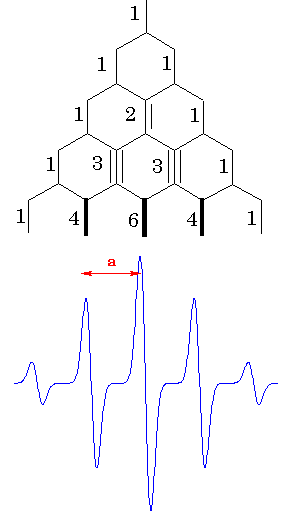 All combinations of the nuclear spin
projections should be included but (EPR allowed) transitions only
between sublevels with the same configurstions of nuclear spins
will be realized. For the case of four equivalent protons, a
simple ladder propagation scheme (Figure on the left) illustrates
how to construct the EPR spectrum. Each new step corresponds to
one more proton added. In the first step, two lines appear
corresponding to the two different orientations of mI
= -1/2 and mI = + 1/2. In the second step,
each line splits into two, corresponding to the two different
orientations of mI = -1/2 and mI
= + 1/2, of the second proton.Since the two protons are
equivalent, the splitting is the same on each step, resulting in
three lines of 1:2:1 intesity ratio. For the four protons, there
will be 5 lines with the 1:4:6:4:1 intensity ratio. Lines with
the lengths of these ratio separated by appropriate constants are
called to represent a stick diagram for the
radical.
If the spin of the nucleus is greater than 1/2, as in the case
of 14N ( I = 1), it splits each of the
electronic levels, a and b, into the 2I + 1 sublevels
resulting in 2I + 1 obeserved lines of equal intensity.
In most cases, one observes a combination of different nuclei
with different constants which sometimes is not as easy to
interpret. 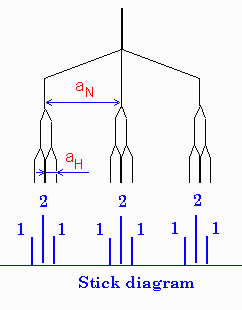 Example of a radical with two different
groups of hfi constants and different nuclei is shown on the
right for a radical with one nitrogen and two equivalent
hydrogens (e.g. NH2).
The magnitude of the hyperfine constants in a radical or radical ion reflects the extent of s character in its orbital (only s-orbital has nonzero density at the nucleus). Sometimes it is quite tricky how s -orbital gets populated. For example, we think of aromatic ion radicals as being purely p-systems, as you will see for yourselves, there are substantial hfi constants on there hydrogens. McConnell6 showed that a aprt of the unpaired p-electron density is transferred through the C-H sigma bonding electrons to the H nucleus via exchange interactions. He provided a simple formular which links the aH on a hydrogen with the unpaired electron spin density on the nearest carbon atom rp:
| aH (G) = - 22.5 rp | (12) |
The signal intensity in EPR depends on how much absorption of the microwave power takes place. This value will be the larger the greater is the difference between populations of the a and b electron spin states. Following Boltzmann statistics, the latter can be estimated :
| (na- nb)/nb = e-DE/kT - 1 ~ gmBBo/kBT | (13) |
a small value for regular X-band EPR spectrometer (9.5 GHz), which can be substanially increased by lowering the temperatute.
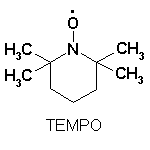
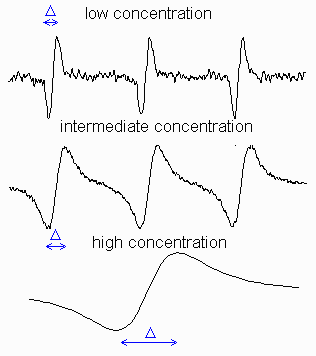 Figure on the right shows how EPR signal shape of a
stable radical, TEMPO (see its structure on the left), varies
with concentration (intensities were scaled to the same hight).
It illustrates that the linewidths of the resonant transitions
are not infinitely small and can be altered by the environment.
At low concentrations, each line has a width because of the heterogeneous
broadening, i.e. unresolved structure of the
small hyperfine constants and the homogeneous broadening,
Go:
| Go = 1/geT2 | (14) |
which is caused by a limited lifetime T2 (also called a spin-spin relaxation time) of a radical at a particular spin state (uncertainty principle related). The constant ge is called the magnetogyric (or gyromagnetic) ratio and relates to Bohr's magneton, mB,
| ge = 4pmB/h = e/mec = 1.77 x 10⁷ s-1 G-1 | (15) |
The full width half maximum, G, is 31/2/2 = 0.866 times greater than the measured distance between maximum and minimum of the experimentaly detective derivative of absorption, i.e. G = 0.866 D. This lifetime can be affected by the dipole-dipole (and exchange) interaction with other radicals. If another unpared electron is at a distance r, the magnitude of its field at the spin can take any value between ± 2mB/r3, depending on orientation. Due to the fast rotation of both radicals, the interaction averages this field to zero except for a very short period of time during collision after which the radical can end up at a random configuration of its nuclear spins. Result of such randomization is equivalent to the jumping from one spectral position to another. For nitroxyl radical, such as TEMPO, with three equivalent spectral lines (S = 1), only 2/3 of such collisions result in a shift. Beacuse of that, the width will increase only at 2/3 of the rate of collision:
| Slow Exchange: | G = Go + 2k[R]/3ge | (16) |
where k is the collision rate constant and [R] is the concentration of radicals. With further increase of the radical concentration, the continuing broadening will be accompanied by a measureable decrease in separation between the peaks, DB:
| Intermediate Exchange: | (aN2 - DB2 )1/2 = 2k[R]/3ge? | (17) |
where aN is the hyperfine constant on nitrogen (separation between lines). After they coalesce, the overall width of now a single-line spectrum, starts decreasing:
| Rapid Exchange: | G = ge(aN2)/k[R] | (18) |
The radicals can exchange spins not on themselves but on any other radical as well. Oxygen has nonzero spin and can also cause the line broadening by the same mechanism. So if your solvent is nonviscous and you want to detect linewidths below 3 G, you may want to get rid of O2.
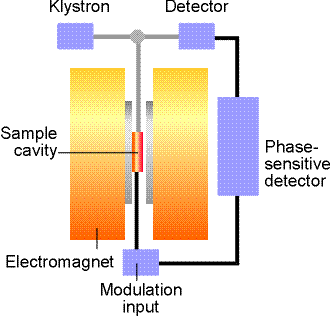 The ESP-300 ESR spectrometer (Bruker)
consists of an electromagnet with power supplies to generate and
modulate a uniform magnetic field of several thousand Gauss, as
well as the components that generate and detect microwave power.
The operation
manual is awailable on the web, courtesy of the University of
Illinois at Urbana-Champaign. I am putting our version as well.
A static magnetic field is provided by an electromagnet with a current- regulated power supply. A homogeneous field is required for best results. A Hall probe, driven from a stable constant-current power system, with a digital multimeter (DMM) reading the Hall voltage, is used to measure the value of the magnetic field between the poles of the magnet.
The microwave system consists of a microwave power supply (on a table above the magnet) which uses a clystron. The ouput of the microwave power (mw) supply is connected via rectangular waveguide (10 GHz) and through a circulator to a high-Q resonant cavity. The samples to be investigated are mounted in the middle of the cavity, where magnetic component of the microwave power has a maximum and is oriented perpendicular to the static field. A microwave diode, which detects the mw resides inside the same box as the power supply. The higher the quality of the resonant cavity the greater the microwave field can be obtained on the sample. Very polar solvents like water absorb efficiently on microwave frequencies themselves (remember microwave ovens?). Because of that, water samples have to be made in narrow cappilaries and carefully located in the center of the cavity. Most of our measurements will be done in the 0.1 - 1.0 mW range.
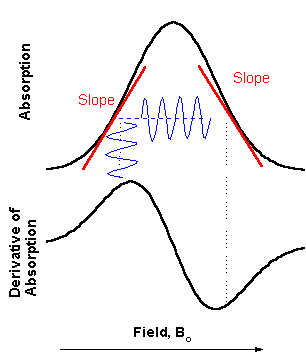 There are variety of schemes
for detecting resonant EPR transitions. Historically, most
popular became a detection of absorption of the microwave power.
To minimize the noise from the mw diode in steady state
measurements, a magnetic field modulation scheme with phase
sensitive detection is usually employed. As a result, the
detected signal appears as a first derivative (see figure on the
right). In the Bruker spectrometer there is choice between 12.5
kHz and 100 kHz modulation frequency. The amplitude of field
modulation (MA) can be varied up to 40 G (4mT). Yo have to be
careful in choosing appropriate MA. If MA is to big, the width
of detected signal derivative would be wider than the real width
of absorption, but if it is too small, the signal intensity
would be less. For most of your case it is good first
approximation to set MA between 0.5 and 1.0 G.
Last updated 05/14/07.