|
Multicanonical Recursion
The animation linked below was developed by
Michael Eichberg during
his internship at FSU's Supercomputer Computation Research
Institute. It relies on simulations performed on an
The initial simulation is performed with
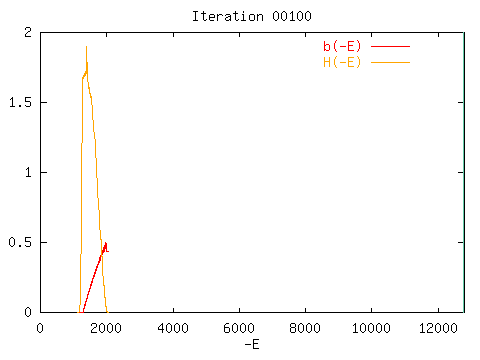
i.e. completely disordered. Updates of the b(E) function are displayed
after 100 iterations of 1000 sweeps each. A
single iteration of b(E) relies on the energy histogram from 1000
sweeps sampled since the previous iteration. The summed up histograms
for 100 iterations are displayed as
H(E). The following picture is the
first one of the animation.

Note that the negative energy -E is used on the abscissa and
the vertical line to the right of the figure is at the minimum
energy, E = -12776, targetted in the
simulation (the absolute minimum of the system is at E = -12800).
Once the targetted minimum energy is reached, the line will move
to E = -1280, which is the average energy for the system at
infinite temperature, i.e. beta=0. It will move back to
E = -12776 when E = -1280 is hit (what happens then quickly)
and so on. The fugacities
Start Animation
In the animation above a constant extrapolation of b(E), indicated by a
tiny extension of the b(E) function, has been used at
small energies (-E large) which have not yet been visited, see
cond-mat/9909236 for more details. However, the performace
without such an extrapolation is almost unchanged. Just the
the "pioneering" edge of the b(E) function is much noisier
as our next animation shows:
Start Animation without b(E) extrapolation.Back to MUCA homepage. |